Op donderdagochtend varen we naar het oosten het laatste stukje van de survey. Om 6:52 UTC bereiken we het eindpunt van het laatste transect op 54.07N-5.01O. We zetten koers naar Scheveningen. Aan boord beginnen we aan de rapportage en de eerste analyses. De echte rapportage zal plaatsvinden in november, in samenwerking met de buitenlandse partners. De figuren die we hieronder presenteren laten enkele voorlopige resultaten zien en hebben alleen betrekking op het door Nederland bestreken gebied.
On Thursday morning we sail to the east for the last part of the survey. At 6:52 UTC we reach the end point of the last transect at 54.07N-5.01O. We set course for Scheveningen. On board we start with the reporting and the first analyses. The real reporting will take place in November, in collaboration with foreign partners. The figures we present below show some preliminary results and only relate to the area covered by the Netherlands.
 |
| De hydrografische stations - CTD opnames - uitgevoerd tijdens deze onderzoeksreis. - The hydrographic stations - CTD downcasts - carried out during this research trip. |
 |
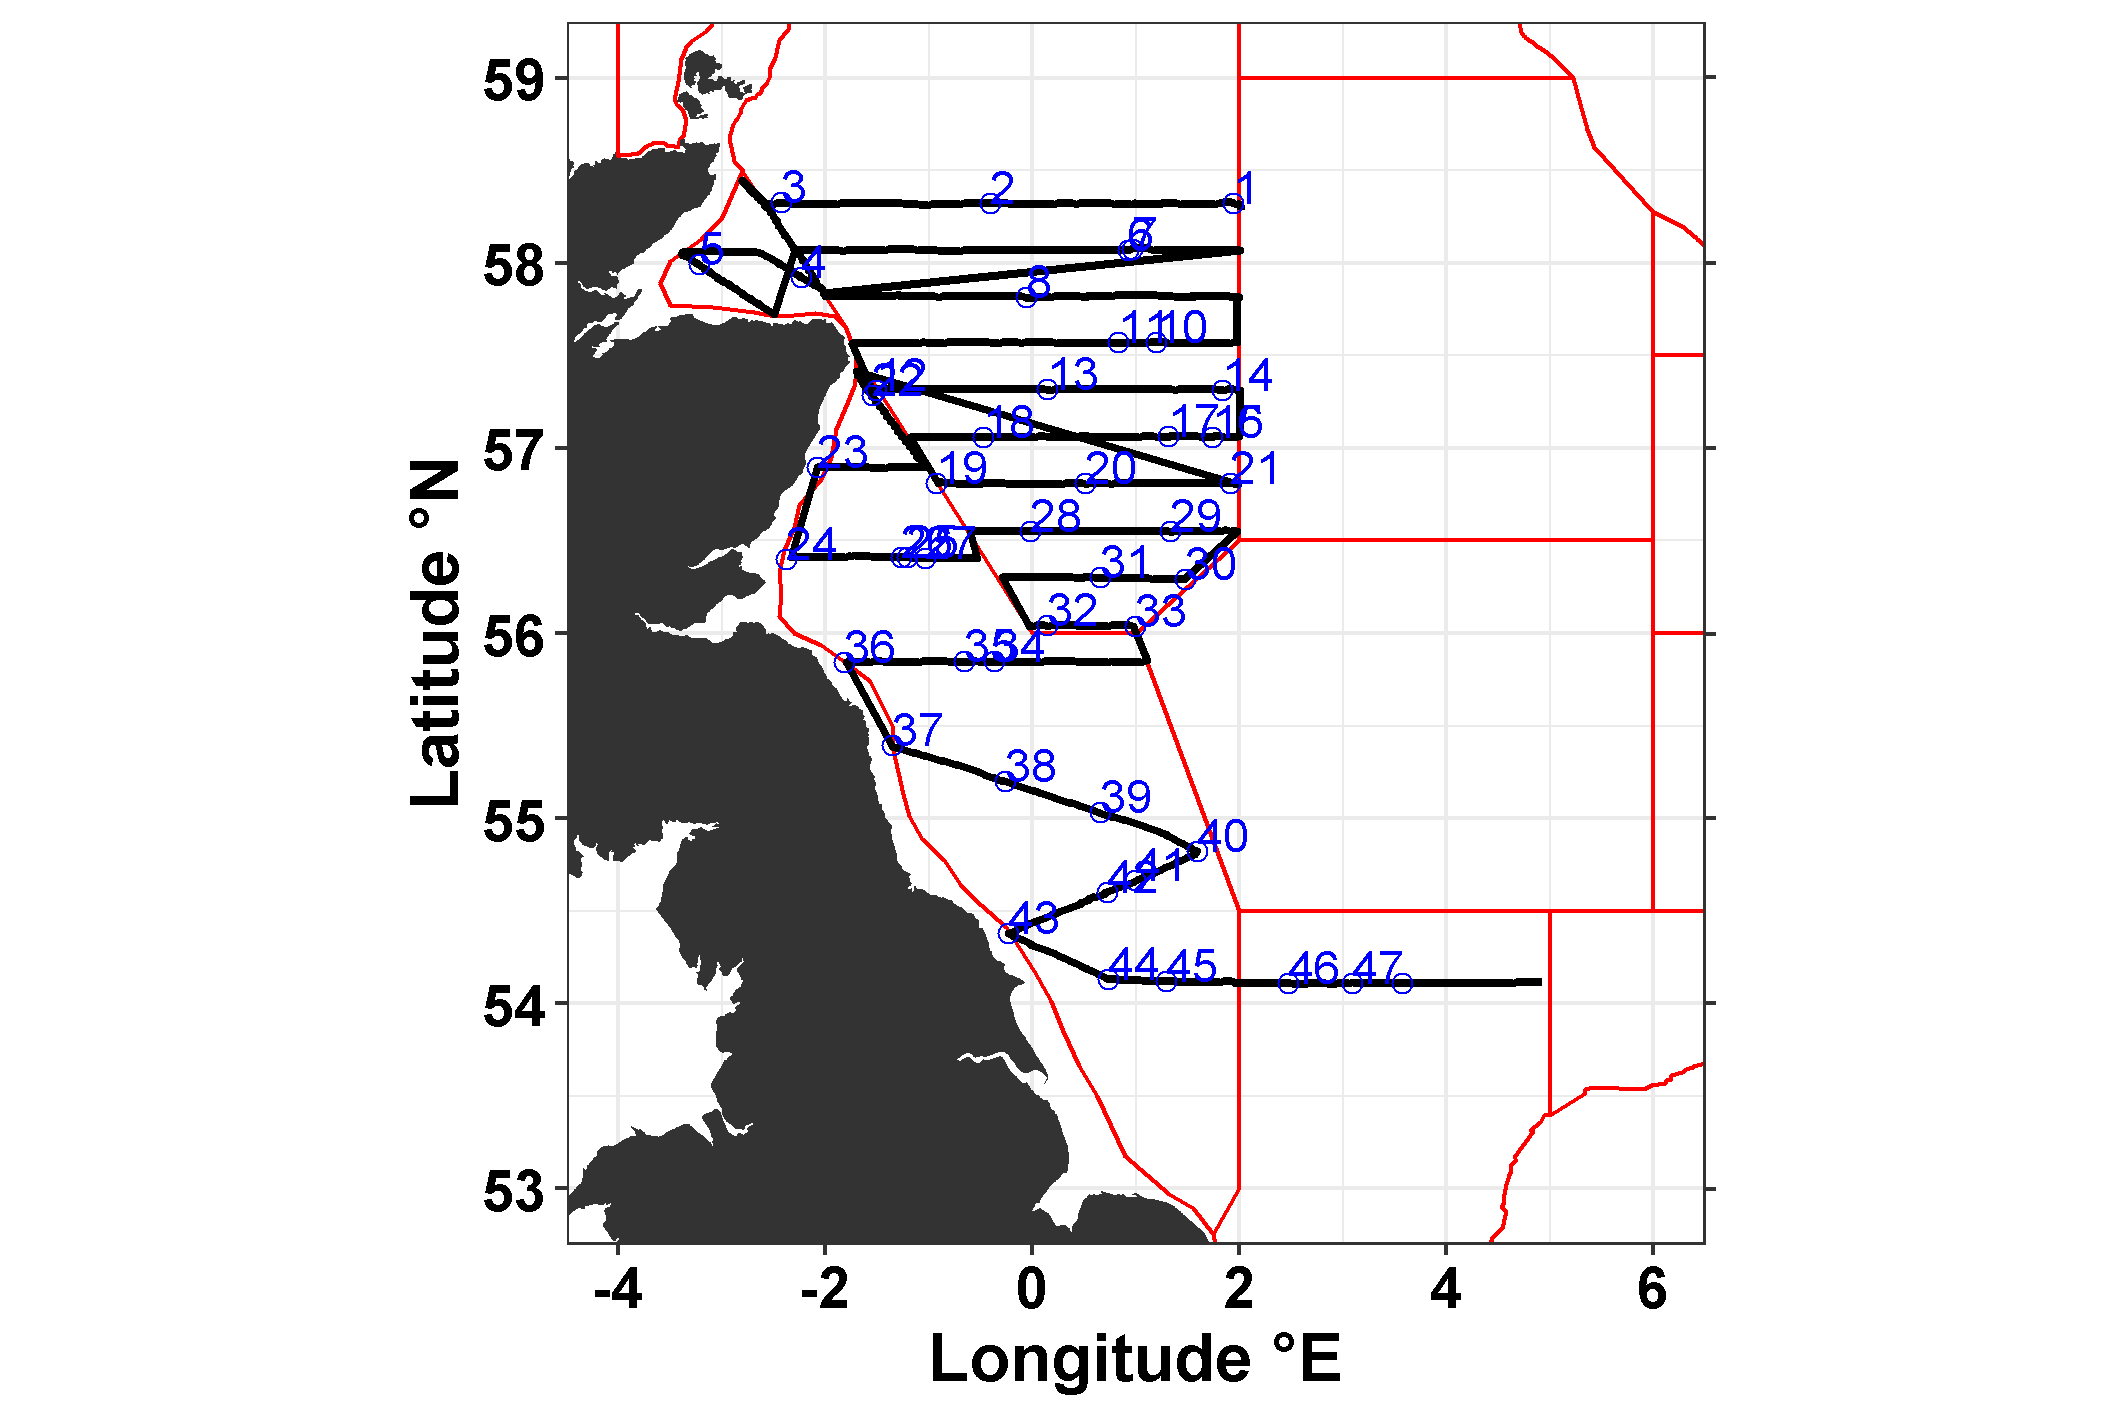
| De vistrekken uitgevoerd tijdens deze onderzoeksreis. - The trawl hauls carried out during this research trip. |
Gewichtsamenstelling van de vistrekken (HAD=schelvis, WHG=wijting, HER=haring, NOP=kever, SAI=zwarte koolvis, SPR=sprot, GUG=grauwe poon, MAC=makreel, DGS=doornhaai. - Weight composition of fish hauls (HAD=haddock, WHG=whiting, HER=herring, NOP=Norwau pout, SAI=saithe, SPR=sprat, GUG=grey gurnard, MAC=mackerel, DGS=spurdog. |
| Proportionele soortsamenstelling van de vistrekken. - Proportional species composition of the trawl hauls. |
 |
| Bubble plot van de akoestisch waarden (SA waarden) van haring per interval van 1 nautische mijl. - Bubble plot of acoustic values (SA values) assigned to herring per 1 nautical mile interval. |
 |
| Bubble plot van de akoestisch waarden (SA waarden) van haring per interval van 1 nautische mijl. - Bubble plot of acoustic values (SA values) assigned to sprat per 1 nautical mile interval. |
 |
| Bubble plot van de akoestisch waarden (SA waarden) van schelvis per interval van 1 nautische mijl. - Bubble plot of acoustic values (SA values) assigned to haddock per 1 nautical mile interval. |
 |
| Bubble plot van de akoestisch waarden (SA waarden) van kever per interval van 1 nautische mijl. - Bubble plot of acoustic values (SA values) assigned to Norway pout per 1 nautical mile interval. |
 |
| Bubble plot van de akoestisch waarden (SA waarden) van wijting per interval van 1 nautische mijl. - Bubble plot of acoustic values (SA values) assigned to whiting per 1 nautical mile interval. |
Op donderdag 21 juli 2022 om 21:00 UTC lopen we binnen in de haven van Scheveningen.
On Thursday 21 July 2022 at 21:00 UTC we enter the harbour of Scheveningen.


No comments:
Post a Comment