Op woensdagavond 18 juli 2018 om 20:58 stoppen we voor de nacht op 54.17N-0.45E. Op donderdag 19 juli wordt op deze positie de draad weer opgepakt om 2:58 UTC in westelijke richting. Om 5:41 op 54.17N-0.07W wordt het einde van het trasect bereikt, we draaien naar het zuidoosten en beginnen om 8:28 UTC op 53.47N-0.21E aan het laatste transect in oostelijke richting. Er wordt niet meer gevist. We doen nog wel twee CTD opnames (nr 37 en 38) en bereiken het einde van het transect op 53.47N-2.00E om 14:16 uur. Vanaf dit punt zetten we koers naar Scheveningen, waar we op vrijdag 20 juli om 4:00 UTC aankomen in Scheveningen.
On Wednesday 18 July 2018 at 20:58 UTC we stop for the night at 54.17N-0.45E. Thursday 19 July 2018 we continue the survey from this position at 2:58 UTC in western direction. At 5:41 at 54.17N-0.07W we arrive at the end of the transect, turn southeast and start at 8:28 UTC at 53.47N-0.21E on our last transect in eastern direction. No fishing today. We carry out two CTD downcasts (no 37 and 38) and reach the end of the transect at 53.47N-2.00E at 14:16 UTC. From this position we set course towards the port of Scheveningen where we arrive at 20 July 4:00 UTC.
 |
| Benoit Berges analyseert de akoestische data van de laatste dag. - Benoit Berges scrutinizes the echograms from the last day. |
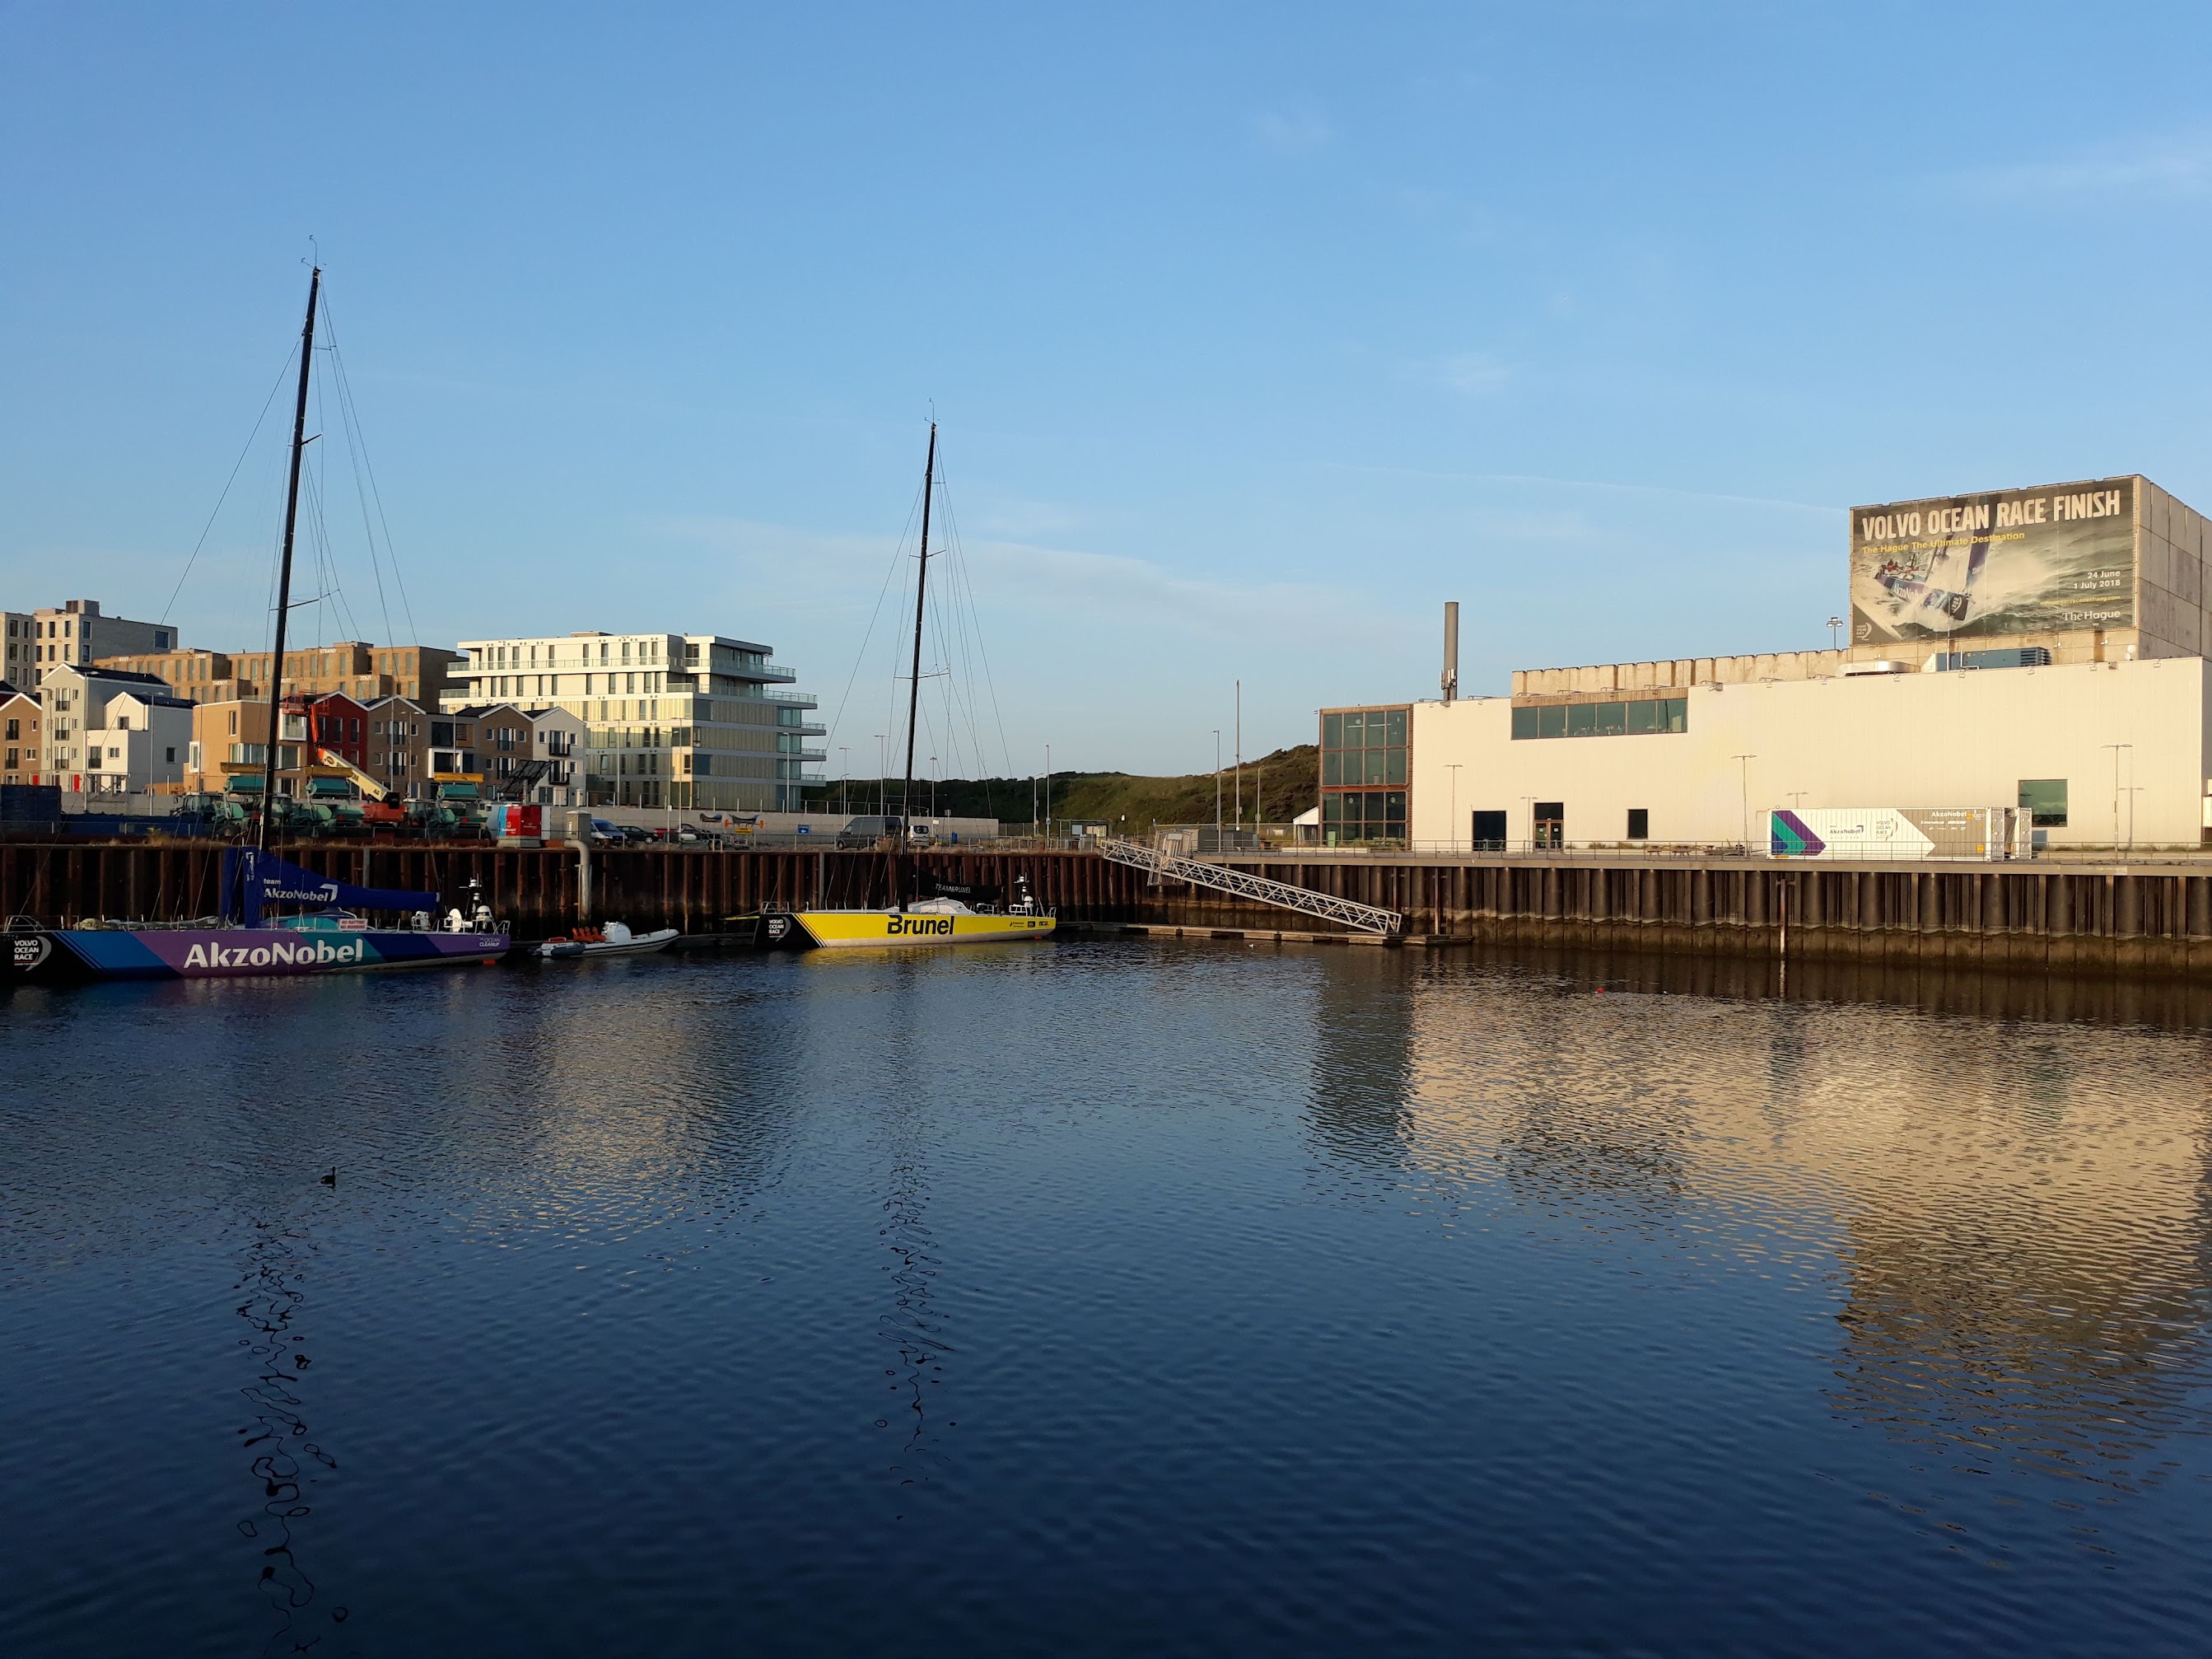 |
| Vrijdagochtend 20 juli 2018. Vanaf de Tridens kijken we uit op de zeilboten van de Nederlandse teams die hebben deelgenomen aan de Volvo Ocean Race. Tijdens onze afwezigheid vond de finish plaats in de haven van Scheveningen, waardoor de Tridens voor vertrek moest verhuizen naar Den Helder. - Friday morning 20 July 2018. From aboard the Tridens we have a view on the sailing boat of the Dutch teams that took part in the Ocean Volvo Race. During our absence the finish took place in the port of Scheveningen, causing the Tridens to move to Den Helder before departure. |
 |
| Bubbel-plot van de verspreiding van haring tijdens de Noordzee akoestische survey voor haring en sprot in 2018. De rode stippen geven de CTD stations aan. De blauwe stippen zijn de locaties waar we gevist hebben. Hier staat is het kaartje van vorig jaar. - Bubble plot of the distribution of herring during the North Sea hydro acoustic survey for herring and sprat in 2018. The red dots indicate the CTD stations. The blue dots are the trawl locations. Here is last years map. |
 |
| Bubbel-plot van de verspreiding van sprot tijdens de Noordzee akoestische survey voor haring en sprot in 2018. De rode stippen geven de CTD stations aan. De blauwe stippen zijn de locaties waar we gevist hebben. - Bubble plot of the distribution of sprat during the North Sea hydro acoustic survey for herring and sprat in 2018. The red dots indicate the CTD stations. The blue dots are the trawl locations. |


No comments:
Post a Comment